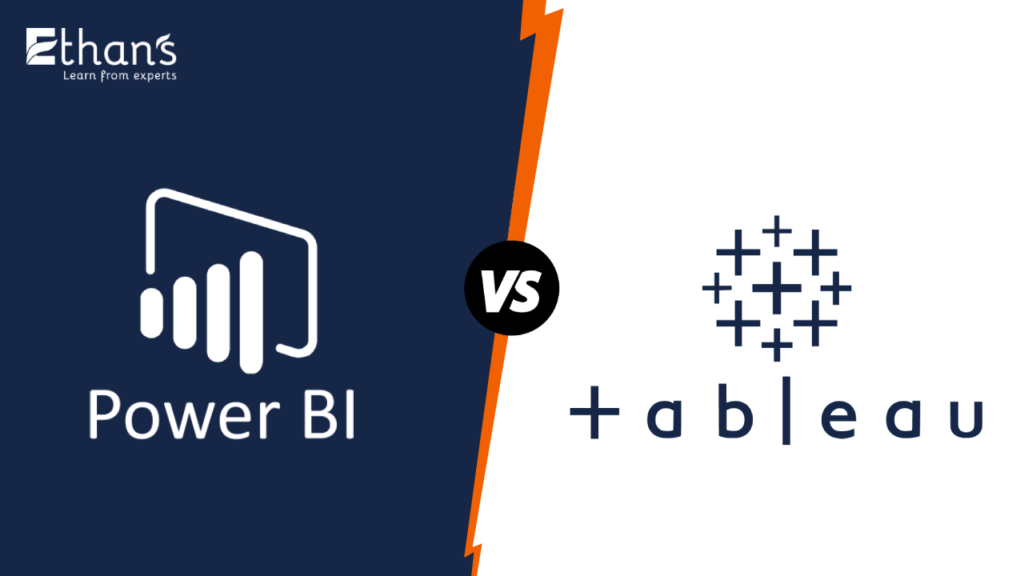
Power BI vs Tableau: Which Business Size and User Are They Targeting?
Power BI aims to be accessible to business users and reduces the difficulty of getting started through extensive ergonomics and diluted technical jargon. Thus, although the Microsoft solution is accessible to all companies, it seems particularly suitable for small to medium-sized companies, which do not necessarily have a large mass of data or even a Big Data environment, nor pure data technicians (such as Data Analysts or Data Engineers).
Tableau is more potent than its competitor, capable of absorbing and manipulating vast amounts of data efficiently. However, its interface and terminologies require a certain degree of competence and expertise in business intelligence to produce relevant dashboards. This solution seems more appropriate for medium to large-sized companies with data experts within their teams.
Power BI vs Tableau: The Easiest to Learn And Use?
● For users accustomed to Microsoft software suites, there will be no change of scenery using Power BI: close to Excel in its appearance, it makes it easier to handle. In addition, its more readable appearance than its competitor makes it easier to use for the uninitiated.
● Finally, its DAX measurement language (KPIs, data restitution, etc.) is close to the syntax used in Excel. It is thus easily understandable for a beginner accustomed to Microsoft’s spreadsheet software.
● Regarding Tableau, the handling, and use could be more intuitive for a beginner. On the other hand, the rise in competence is rapid and quickly makes it possible to arrive at relevant dashboards and reports. In expert hands, Tableau proves to be more potent than its competitor. If you need assistance, Tableau’s technical support and community are more responsive than Microsoft’s.
Power BI vs Tableau: Best in Data Connection and Preparation?
● Power BI has access to many data sources, whether relational like PostgreSQL or MySQL, flat files (Excel, CSV, etc.), or Big Data oriented like Apache Hive. Several pre-built dashboards can be connected to services like Salesforce or Google Analytics so that you can quickly process and analyze this data.
● Tableau also takes advantage of many data sources. The publisher collaborates with cloud providers such as Amazon or Cloudera to offer wide and varied connectors, particularly Big Data oriented (Cloudera Hadoop, Apache Hive, Spark SQL, etc.).
● Tableau is more efficient with table-oriented data; however, where Power BI can work with a star data model, performing joins itself. Data preparation is, therefore, essential when you want to implement the Tableau Software solution.
● This preparation is done naturally using Power Query within Power BI. It is designed to make it easier for business users to get started and offers many transformations through buttons or in a logic similar to that provided by Excel. More advanced, Tableau’s data preparation system is a full-fledged software, Tableau Prep Builder. It is mainly “no-code” software, intuitive, however requiring a minimum of knowledge in data preparation.
Power BI vs Tableau: Best in Data Analysis?
● Tableau has a significant advantage over its competitor in data analysis (or “Data Analytics”). Indeed, it can process and analyze much larger quantities of data than its competitor, thus establishing itself in Big Data environments. It does not limit the number of points displayed in its visualizations, nor the number or the length of the lines, making it possible to obtain an overall view of the data studied.
● Power BI, meanwhile, is progressing in its data management but still needs to catch up; capable of handling moderate to large volumes if they are adequately prepared and structured. Both tools have augmented analytics features, which rely on artificial intelligence and machine learning. Natural language query tools, Ask Data for Tableau or Questions and Answers for Power BI, are proving relevant and making data exploration easier.
Power BI vs Tableau: Best in Data Visualization?
● When talking about data visualization (or “data viz”), Power BI and Tableau are essential references. Both tools make it possible to make the best use of data within a company to move towards a Data-Driven mode of operation. On either side, creating dynamic, clear, and aesthetic dashboards with an intuitive “drag and drop” creation mode is possible. What are the points that distinguish them?
● This “drag and drop” aspect is reinforced on the side of the Microsoft tool, always with a desire to be as intuitive as possible as a self-service BI solution. Everyone can thus embark on the construction of dashboards, whether they have a technical background or not. The dashboards are much more flexible in their layout, to the detriment of the visualization catalog, which is slightly lower than that offered by its main competitor. So, Power BI vs Tableau returns the favor regarding dataviz. Power BI will be more pleasant to novice users, whereas Tableau is better suited to more expert technical users.
What Should You Choose: Data Analytics or Data Science?
Data Analytics
Data Analytics refers to examining, cleaning, transforming, and modeling data to discover useful information, draw conclusions, and support decision-making. It is a field that utilizes statistical, computational, and visual techniques to extract insights and knowledge from structured and unstructured data.
Data analytics can be used in various industries, including business, healthcare, finance, and retail. In the business world, data analytics can identify patterns in customer behavior, identify areas for cost reduction, and optimize marketing campaigns. In healthcare, data analytics can improve patient outcomes and reduce costs by recognizing patterns in patient data. In finance, data analytics can identify financial market trends and predict future performance.
Data visualization tools like Tableau and Power BI allow for creating interactive dashboards and charts to help users understand and explore their data. Programming languages such as Python, R, and SQL are used for data cleaning, transformation, and modeling. Statistical analysis tools, such as R, SAS, and SPSS, are used to perform statistical analysis on data. Data mining tools, such as KNIME, RapidMiner, and Weka, are used to identify patterns and trends in data.
Data visualization tools like Tableau and Power BI allow for creating interactive dashboards and charts to help users understand and explore their data. Programming languages such as Python, R, and SQL are used for data cleaning, transformation, and modeling. Statistical analysis tools, such as R, SAS, and SPSS, are used to perform statistical analysis on data. Data mining tools, such as KNIME, RapidMiner, and Weka, are used to identify patterns and trends in data.
Data Science
Data Science is an interdisciplinary field that uses scientific methods, processes, algorithms, and systems to extract knowledge and insights from structured and unstructured data. Data Science combines various fields like statistics, mathematics, computer science, domain expertise, and machine learning.
Data Science is a rapidly growing field with applications in many industries, including business, healthcare, finance, and technology. In business, data science can predict consumer behavior, identify new market opportunities, and optimize pricing and inventory. In healthcare, data science can be used to predict patient outcomes and improve the efficiency of healthcare delivery. In finance, data science can be used to detect fraud and predict market trends. In technology, data science can improve website personalization, search engine results, and chatbot conversations. Machine learning algorithms, such as decision trees, random forests, and neural networks, can make predictions and identify patterns in data. Programming languages such as Python and R are used for data cleaning, transformation, and modeling. Big data tools such as Hadoop and Spark are used to process and analyze large amounts of data.
● Data Analytics and Data Science are two related but distinct fields that have gained significant attention in recent years due to the increasing amount of data generated by businesses and organizations. While both areas involve working with data, they have distinct goals, tools, and techniques.
● One of the main similarities between data analytics and data science is that both fields involve working with data to extract insights and knowledge. Both areas also require strong analytical skills and the ability to think critically. However, the primary difference between data analytics and data science lies in the scope and goals of each field.
● Data Analytics is focused on analyzing data to support decision-making and problem-solving. It is primarily concerned with understanding and interpreting the data, identifying patterns and trends, and drawing conclusions. Data analytics is often used to support specific business goals, such as cost reduction, identifying new revenue streams, or improving customer satisfaction.
● On the other hand, data science is a broader field that encompasses various techniques like Machine Learning, Deep Learning, NLP, and Computer Vision to extract insights from data. Data Science is focused on discovering new knowledge and insights from data that can be used to make predictions, build models, and support decision-making. Data science is often used to solve complex problems, such as predicting customer behavior or identifying market trends.
● In terms of tools and techniques, data analytics primarily uses statistical and visualization tools, while data science often uses machine learning algorithms and big data tools. Data analytics also tends to focus on structured data, while data science often deals with unstructured data.
● In terms of the skills required, data analytics requires strong analytical and mathematical skills and knowledge of programming languages and databases. On the other hand, data science requires not only those skills but also experience with machine learning algorithms and big data tools, as well as domain expertise.
● In conclusion, Data Analytics and Data Science are two different fields, but they are related and often complementary. Data analytics is focused on understanding and interpreting data to support decision-making. In contrast, data science is focused on discovering new knowledge and insights from data that can be used to make predictions and build models. Data analysts and scientists often work together to extract insights from data and make data-driven decisions.
Fake Experience Certificate May Ruin Your Career!!
Experience certificates are an essential aspect of a person’s professional Career. They are used to verify an individual’s work history and qualifications to secure employment or advance in their current job. However, in some cases, individuals may be tempted to use a fake experience certificate to gain an advantage in the job market. This is a dangerous and unethical practice that can have severe consequences for the individual’s Career. In this blog post, we will discuss the dangers of using a fake experience certificate and how it can ruin a person’s Career.
● The consequences of using a fake experience certificate can be severe and long-lasting. One of the most immediate consequences is the loss of credibility and trust. When an employer discovers that an individual has used a fake experience certificate, they will likely lose faith in their integrity and honesty. This can make it difficult for the individual to find employment in the future, as other employers may also be skeptical of their qualifications.
● Another significant consequence of using a fake experience certificate is the legal repercussions. Depending on the jurisdiction, using a fake document may be considered a criminal offense. This can lead to fines, jail time, and other penalties.
● Additionally, many companies have strict policies against lying on job applications or in interviews, including using fake experience certificates. If an employee is found to have lied on their application or during an interview, they may be terminated or disciplined. This can have a long-term effect on the employee’s professional reputation and future job prospects.
● Another consequence of using a fake experience certificate is the potential to be exposed during employment. Employers often verify the authenticity of experience certificates, and if they find out that an individual has used a fake certificate, they may terminate their work or take legal action. This can lead to a tarnished reputation, not just with that employer but also with other companies in the industry. This can make it difficult for the individual to find employment in the future and may even lead to the loss of their current job.
● Furthermore, a fake experience certificate can damage an individual’s professional reputation. Colleagues and peers may view the individual as dishonest and untrustworthy. This can lead to difficulty building and maintaining professional relationships, which is crucial for career advancement.
● Additionally, using a fake experience certificate can also lead to a lack of job satisfaction and fulfillment. Even if an individual can secure a job using a fake certificate. They may find themselves in a position they are not qualified for and unable to fulfill the responsibilities. This can lead to job dissatisfaction and burnout, which can affect an individual’s mental and physical health.
The consequences of using a fake experience certificate can be severe and far-reaching. Understanding the risks and potential consequences is essential before considering using a fake certificate. The best way to succeed in the job market is to build a legitimate career by gaining the necessary qualifications and experience through hard work and dedication.
Prevention and alternatives are crucial to avoiding using a fake experience certificate. One of the best ways to prevent the use of fake certificates is by providing individuals with alternative ways to gain experience and prove their qualifications. This can include internships, volunteer work, or other forms of on-the-job training. These opportunities can help individuals gain the necessary knowledge and capabilities to secure employment or advance in their Careers.
Another preventative measure is, to be honest, and transparent about your qualifications and experience. This can include being upfront about gaps in your work history or explaining how you gained your experience. This honesty and transparency can help build trust with potential employers, making it less likely that they will suspect you of using a fake certificate.
Additionally, being vigilant and aware of the warning signs of fake certificates is essential. This includes being cautious of certificates that appear altered or contain spelling and grammar errors. These certificates are not issued by a credible institution or company and must be in the correct format.
Lastly, it’s essential to have a good understanding of your rights and the laws related to using fake certificates. This can help you avoid legal repercussions and ensure you are not breaking any rules.


