Skip to content
- Admission Open For New batch
Data Analytics Course in Pune
In Association with:
Certification aligned to:

- Advanced Certification Training Program by Ethan’s.
- 06 Months technical training program with hybrid classes (online + offline), ideal for learners looking for data analyst training or data analytics classes in Pune.
- Suitable for professionals, college students, graduates, postgraduates, candidates with a career gap, and early professionals.
- Start from scratch – no prior experience needed, all prerequisites will be covered.
- Next-Gen curriculum for the age of ChatGPT, Generative AI, and modern business intelligence systems.
- Future-ready content for the age of ChatGPT, Generative AI, and intelligent automation.

11th Apr
Next Batch
06 Months
Course Duration
Hybrid
Online + Offline
5 LPA
Avg Package


Data Analytics Training in Pune
Data Analytics Training in Pune
Enroll in Ethan’s Data Analyst Course in Pune to acquire the skills and knowledge essential for success in data analytics. Our comprehensive program covers the latest tools and techniques, including SQL, Excel, and Python for data handling, as well as Tableau, Power BI, and Alteryx for data visualization. Gain the expertise to solve real-world business challenges using a wide range of data analytics tools. Join our Data Analytics Courses in Pune and take the first step toward becoming a proficient data analyst. At Ethan’s, we emphasize hands-on training with real-world datasets, ensuring you gain practical experience alongside strong theoretical foundations. Our experienced instructors, who are industry professionals, guide you through complex data analysis concepts and workflows, ensuring clarity and confidence at every stage.
Choose top-rated data analytics classes near me and enroll in a Data Analyst Course near me in Pune to enhance your skills and accelerate your career growth.
Register to confirm your seat. Limited seats are available.
Guest Lectures by IIT professors
Ethan's Tech Career Track
IIT Approved Mentors
Advance Curriculum
Data Analytics Training Location
- Wakad
- Kharadi
- Shivajinagar


Learn From the Masters
Our team is made up of industry experts, seasoned professionals, and passionate trainers who work together as a close-knit family. We believe in not just teaching, but inspiring and growing together — creating a learning environment that feels like home and performs like the best in the business.

Gurjeet Sir
Ex IIT Kharagpur, AI

Sachin Sir
Ex Microsoft – Azure

Vinit Sir
Ex IIT Bombay, GenAI

Alam Sir
Cloud & DevOps Architect

Jatin Sir
Ex Credit Suisse, Python

Siddhant Sir
Ex IIIT Allahabad, DSA

Raman Sir
Ex-Data Analyst, MuSigma

Anurag Sir
Ex-IIM Bangalore, GenAI

Himanshu Sir
Unlock 20,000+ Worth of Premium Bonuses 100% FREE!
Master the Best Tech Tools


About the Course
Certified Data Analytics Course Classes in Pune
What is Data Analytics all about?
Data analytics involves the systematic computational analysis of data. It is used to discover patterns, correlations, and trends in data, and to extract valuable insights that inform decision-making. Here’s a deeper look into what data analytics entails:
1. Data Collection
Data analytics begins with gathering data from various sources. This data can be structured (e.g., databases, spreadsheets) or unstructured (e.g., text, images).
2. Data Cleaning
Raw data often contains errors, duplicates, or inconsistencies. Data cleaning involves preprocessing the data to correct or remove these issues, ensuring the data is accurate and ready for analysis.
3. Data Exploration
This step involves initial data examination to understand its structure, distribution, and key characteristics. Tools like descriptive statistics and data visualization techniques are used to summarize the data.
4. Data Analysis
The core of data analytics, this stage uses various techniques to delve deeper into the data:
- Descriptive Analytics: Summarizes past data to understand what happened.
- Diagnostic Analytics: Examines data to determine why something happened.
- Predictive Analytics: Uses historical data to make predictions about future events.
- Prescriptive Analytics: Recommends actions based on the data analysis.
5. Data Visualization
Data visualization involves creating visual representations of the data, such as charts, graphs, and dashboards, to make the insights more accessible and understandable.
6. Data Interpretation
Interpreting the results of the analysis is crucial. It involves drawing meaningful conclusions and making data-driven decisions.
7. Reporting
The final insights are compiled into reports that communicate the findings to stakeholders, helping them understand the data and take informed actions.
Which are the different types of Data Analytics?
Data Analytics majorly have 4 verticals, which are
- Descriptive Analytics: It helps the organizations or developers answer the various questions regarding the happenings or the situations
- Diagnostic Analytics: It helps the developers and the organizations to understand why the situation occurred or why it happened.
- Predictive Analytics: It helps organizations understand the trend and predict what will happen in the future.
- Prescriptive Analytics: It helps the organizations know what steps should be taken to the situations and happenings which might occur in the future.
Why choose Ethans Tech for Data Analytics Course?
1. Comprehensive Curriculum: Ethans Tech offers a well-rounded Data Analytics course covering essential topics such as data handling, statistical analysis, machine learning, data visualization, and more. Our curriculum is designed to provide both theoretical knowledge and practical skills.
2. Expert Instructors: Learn from industry experts with extensive experience in data analytics. Our instructors bring real-world insights and hands-on expertise to the classroom, ensuring you receive top-notch education and mentorship.
3. Hands-on Learning: Our course emphasizes practical learning through real-time projects, case studies, and interactive sessions. You’ll work on real-world datasets and apply your skills to solve practical problems, making you industry-ready.
4. State-of-the-Art Resources: Gain access to cutting-edge tools and technologies used in the data analytics field. From software like Python and R to libraries such as Pandas, NumPy, and Matplotlib, you’ll be well-equipped with the resources needed for success.
5. Industry-Relevant Certifications: Earn a certification from Ethans Tech, recognized and valued by employers in the industry. Our partnerships with leading organizations and institutions add further credibility to your credentials.
6. Flexible Learning Options: We offer both online and offline training options to suit your schedule and learning preferences. Whether you prefer the convenience of online learning or the interactive experience of classroom sessions, we have you covered.
7. Strong Placement Support: Benefit from our robust placement support services, including resume building, interview preparation, and job placement assistance. Our dedicated placement team works tirelessly to connect you with top employers in the industry.
8. Proven Track Record: Ethans Tech has a reputation for excellence in IT training. Our alumni have gone on to secure prominent positions in leading companies, and our courses are highly rated for their quality and effectiveness.
9. Continuous Learning and Support: Stay updated with the latest trends and advancements in data analytics through our continuous learning programs. We offer workshops, webinars, and alumni support to keep you ahead in your career.
10. Community and Networking: Join a vibrant community of learners, alumni, and professionals. Engage in networking opportunities, participate in events, and be part of a supportive ecosystem that fosters growth and collaboration.
Choose Ethans Tech for your Data Analytics course and embark on a journey to become a skilled and sought-after data analytics professional.
How Ethans provide the training?
1. Expert-Led Instruction: Our courses are taught by industry experts with extensive experience in their respective fields. Instructors bring real-world knowledge and practical insights to ensure you receive high-quality education.
2. Comprehensive Curriculum: Each course is meticulously designed to cover all necessary concepts, tools, and technologies. The curriculum is regularly updated to keep pace with industry trends and advancements.
3. Hands-On Learning: We emphasize practical, hands-on training. You will work on real-time projects, case studies, and exercises that simulate actual industry scenarios, helping you apply theoretical knowledge in a practical context.
4. Interactive Classes: Our training sessions are highly interactive, encouraging active participation from students. Whether online or offline, you’ll engage in discussions, Q&A sessions, and collaborative activities.
5. Flexible Learning Options: Ethans Tech offers both online and offline training options to cater to different learning preferences and schedules. Online classes provide the flexibility to learn from anywhere, while offline classes offer a traditional classroom experience.
6. State-of-the-Art Tools and Technologies: Students get access to the latest tools and technologies relevant to their field of study. This includes software, programming languages, and analytical tools essential for modern IT and data analytics roles.
7. Real-Time Projects: You will work on real-time projects that reflect current industry challenges and requirements. These projects help you build a robust portfolio and demonstrate your skills to potential employers.
8. Continuous Assessment and Feedback: Our training includes regular assessments through quizzes, assignments, and projects. Instructors provide continuous feedback to help you improve and stay on track with your learning goals.
9. Support and Mentorship: Students receive ongoing support and mentorship from instructors and peers. Our community is dedicated to helping each other succeed, providing guidance and assistance whenever needed.
10. Placement Assistance: Ethans Tech offers robust placement support, including resume building, interview preparation, and job placement services. Our dedicated placement team works to connect you with leading employers in the industry.
11. Certification: Upon successful completion of the course, students receive a certification from Ethans Tech, recognized and valued by employers. This certification validates your skills and knowledge in the respective field.
12. Alumni Network: Join a growing network of Ethans Tech alumni who have successfully transitioned into prominent roles in the industry. Benefit from networking opportunities, events, and continuous learning resources.
By combining expert instruction, practical experience, and robust support, Ethans Tech ensures you are well-prepared to excel in your chosen field.
Syllabus
Data Analytics Classes in Pune
Data Analytics Training Content
Python Essentials: Learn, Code, Create
Python Basics: Learn to Code
- Introduction to Python Programming:
- Basic Data Types in Python
- Variables and Naming Conventions
- Data Types in Python:
- Data Structure
- Python String Object
- Python List and Tuple Objects
- Python Dictionary Object
- Python Set Object
- Indexing & Slicing:
- Importance of indexing in Python
- Introduction to Slicing
- Indexing and Slicing in Strings
- Indexing and Slicing in Lists and Tuples
- Operators in Python:
- Arithmetic Operators
- Comparison Operators
- Logical Operators
- Assignment Operators
- Membership Operators
- In-Built Functions & Methods:
- Exploring Built-in Functions
- Use Built-in Functions with data types
- Introducing Built-in Methods for specific data types
-
Python Control Flow Simplified
- Statements, Indentation and Conditionals:
- Statements and Indentation
- Introduction to Conditional Statements
- Combining Multiple Conditions
- Loops & Iterations:
- Conditional Loops (While Loop)
- Conditional Loops (For Loop)
- Master ‘for’ loops, Learn ‘while’ loops
- Comprehend loop control statements
- Explore nested loops
- Statements, Indentation and Conditionals:
-
Building Smarter Programs
- Custom Functions in Python:
- Introduction to Custom Functions
- Defining and Calling Custom Functions in Python
- Working with Arguments and Return Values
- Advanced Looping Concepts:
- List Comprehension
- Set Comprehension
- Dictionary Comprehension
- Lambda Functions
- OOPs in Python:
- Introduction to Object-Oriented Programming (OOPs)
- Creating and Working with Classes
- Understanding Objects and Instances
- Working with Attributes
- Utilizing Methods in Classes
- Embracing Polymorphism
- Leveraging Inheritance
- Exception Handling & Logging:
- Introduction to Exception Handling
- Try-Except Block: Catching Exceptions
- Handling Specific Exceptions
- Finally Block: Cleaning Up After Exceptions
- Raising Exceptions: Taking Control
- Handling Multiple Exceptions: The Exceptional Mastery
- Custom Functions in Python:
Numerical Programming in Python
-
Python Data Structures and Algorithms
- Data Structures Fundamentals:
- Introduction to Data Structures
- Arrays
- Efficient String Operations:
- Introduction to Strings
- Combining strings using concatenation (+)
- Searching and Finding
- Introduction to regex
- Recursion Fundamentals:
- Understanding Recursion: Introduction and Basics
- Recursive Function Design
- Implementing Recursion in Algorithms
- Analyzing Recursive Calls
- Mastering Recursion Concept:
- Time and space complexity
- Algorithm Fundamentals:
- Introduction to Algorithms
- Big O Notation
- Sorting Algorithms
- Searching Algorithms
- Data Structures Fundamentals:
-
Python Data Wrangling
- Getting Started with Pandas & Numpy:
- Introduction to Pandas & Numpy
- Mastering Data Wrangling:
- Series and dataframes
- Indexing and slicing
- Manipulating data
- Advanced Data Wrangling Concepts:
- Introduction to Data Wrangling
- Handling Missing Data
- Merging and Joining Data
- Grouping and Aggregation
- Reshaping Data
- Filtering Data
- Data Wrangling – Code Optimisation:
- Techniques for Code Optimization
- Strategies for Parallel and Distributed Data Wrangling
- Best Practices for Efficient Data Wrangling
- Data Wrangling on Different Data Formats:
- Data Wrangling on Different Data Formats
- Data Management Libraries:
- File Management Libraries
- Data Manipulation Libraries
- Data Visualization Libraries
- Web Scraping
- Regular Expression Libraries
- Date and Time Libraries
- Web Scraping using Python:
- Introduction to Web Scraping
- Getting Started with Pandas & Numpy:
-
Python Visualization Libraries in Action
- Data Visualization with Matplotlib & Seaborn:
- Introduction to Matplotlib and Seaborn Plots
- Data Visualization with Matplotlib & Seaborn:
Relational Databases
- Introduction to SQL: Learn the Lang. of Data
- SQL Basics for Data Analysis
- Introduction to SQL
- Setting up the SQL environment
- Basic SQL Commands
- Creating and Deleting Databases and Tables
- Importing and Exporting Data from CSV Files
- Fundamentals of SQL Query
- Anatomy of SQL Query
- SQL Data Types and Operators
- Filtering and Sorting Data in SQL
- Aggregate functions in SQL
- Dealing With Multiple Tables
- Grouping Data – GROUP BY
- HAVING
- Subqueries
- Joining tables using INNER JOIN, LEFT JOIN, RIGHT JOIN & FULL OUTER JOIN
- Alias in SQL queries
- Working with Multiple Tables Using Subqueries
- Using Set Operators
- Aggregating Data from Multiple Tables using GROUP BY and HAVING
- Advanced SQL Joins
- Advanced Join Techniques
- Joining multiple tables
- Handling duplicate records and eliminating duplicates
- Using UNION and UNION ALL to combine data from multiple tables
- SQL In-Built Functions
- Type Casting & Math Functions
- Mathematical Functions
- Type Conversion Functions
- Using CASE Statements to Perform Conditional Operations
- DateTime & String Functions
- Working with date/time data in SQL
- Date/time functions
- Formatting date/time data
- String manipulation functions (UPPER, LOWER, LEFT, RIGHT, etc.)
- Regular expressions in SQL for string operations
- Using CONCAT_WS to concatenate strings with a separator
- Window Functions
- Syntax of Windows Function
- Ranking functions (ROW_NUMBER, RANK, DENSE_RANK, etc.)
- Aggregate functions using windows (SUM, AVG, MAX, MIN, etc.)
- Partitioning data for window functions
- Understanding row-based vs aggregate-based window functions
Microsoft Excel
- Introduction to Excel
- Excel Interface Overview
- Navigating the Ribbon
- Understanding Worksheets and Workbooks
- Creating and Saving Workbooks
- Data Entry and Editing
- Customizing the Quick Access Toolbar
- Excel File Formats
- Basics of Excel
- Basic Data Types (Numbers, Text, Dates)
- Basic Excel Operations (Copy, Cut, Paste)
- Autofill and Flash Fill
- Sorting and Filtering Data
- Basic Cell Formatting (Font, Color, Alignment)
- Using the Clipboard
- Adjusting Column Width and Row Height
- Excel Formula
- Basic Arithmetic Formulas (SUM, SUBTRACT, MULTIPLY, DIVIDE)
- AutoSum Function
- Cell References (Relative, Absolute, Mixed)
- Common Statistical Functions (AVERAGE, MEDIAN, MODE)
- Text Formulas (CONCATENATE, LEFT, RIGHT)
- Date Formulas (TODAY, NOW, DATE)
- Logical Formulas (IF, AND, OR)
- Formula Based Formatting
- Conditional Formatting Rules
- Highlighting Cells Based on Values
- Data Bars, Color Scales, and Icon Sets
- Custom Conditional Formatting
- Managing Conditional Formatting Rules
- Using Formulas in Conditional Formatting
- Applying Conditional Formatting to Pivot Tables
- Conditional Statements & Logical Operators
- IF Statements
- Nested IF Statements
- AND, OR Operators
- NOT Operator
- Combining Multiple Conditions
- Using IF with Text, Numbers, and Dates
- Conditional Formatting with Logical Operators
- Text Functions
- CONCATENATE (or CONCAT)
- LEFT, RIGHT, MID
- LEN and TRIM
- UPPER, LOWER, PROPER
- SUBSTITUTE and REPLACE
- FIND and SEARCH
- TEXT Function for Formatting Numbers and Dates
- Date and Time Functions
- TODAY and NOW
- DATE and TIME
- DAY, MONTH, YEAR
- HOUR, MINUTE, SECOND
- DATEDIF
- NETWORKDAYS
- EDATE and EOMONTH
- Excel Tables
- Creating and Formatting Excel Tables
- Table Styles and Options
- Sorting and Filtering Tables
- Adding and Removing Table Rows/Columns
- Structured References
- Table Calculations and Totals
- Converting Table to Range
- Basic and Advanced Table Operations
- Creating Dynamic Tables
- Using Table Formulas
- Advanced Filtering Techniques
- Using Slicers with Tables
- Advanced Sorting Techniques
- Working with Subtotals
- Merging and Splitting Tables
- Data Pivoting with Different Examples
- Creating PivotTables
- PivotTable Fields and Areas
- Grouping Data in PivotTables
- PivotTable Calculations (Sum, Count, Average)
- Creating Pivot Charts
- Filtering PivotTables with Slicers and Timelines
- Advanced PivotTable Techniques (Calculated Fields, Custom Calculations)
- Cell Reference Functions
- Understanding Cell References
- Using Relative References
- Using Absolute References
- Mixed References
- INDIRECT Function
- OFFSET Function
- Linking Cells Between Sheets and Workbooks
- LookUp and VLookUp
- Introduction to LookUp Functions
- VLOOKUP Basics
- HLOOKUP Basics
- Using VLOOKUP with Exact and Approximate Match
- Combining VLOOKUP with Other Functions
- Common VLOOKUP Errors and Fixes
- Alternatives to VLOOKUP (INDEX and MATCH)
- Excel Data Visualization
- Creating Basic Charts (Column, Line, Pie)
- Customizing Chart Elements (Titles, Legends, Labels)
- Using Sparklines for Miniature Charts
- Creating Combo Charts
- Using Conditional Formatting for Data Visualization
- Creating Heat Maps
- Using Data Bars and Color Scales
- Basic Charts in Excel
- Creating Column Charts
- Creating Line Charts
- Creating Pie Charts
- Creating Bar Charts
- Creating Area Charts
- Creating Scatter Plots
- Customizing Chart Types and Styles
- Formatting Charts
- Adding and Formatting Chart Titles
- Customizing Axes (Titles, Scales, Gridlines)
- Formatting Data Series (Colors, Styles)
- Adding Data Labels and Legends
- Applying Chart Styles and Themes
- Using Templates for Charts
- Interactive Charts with Form Controls
- Introduction to Power Query
- What is Power Query?
- Power Query Interface Overview
- Loading Data into Power Query
- Basic Data Transformation (Filter, Sort, Remove Columns)
- Combining Data from Multiple Sources
- Data Profiling in Power Query
- Saving and Loading Data to Excel
- Creating Reports in Excel with Dataset
- Data Preparation and Cleaning
- Using PivotTables for Reports
- Combining Multiple Data Sources
- Adding Visual Elements (Charts, Sparklines)
- Creating Interactive Dashboards
- Automating Report Updates
- Distributing and Sharing Reports
- VBA and Macros
- Introduction to VBA and Macros
- Recording and Running Macros
- Editing Macro Code
- VBA Basics (Variables, Loops, Conditionals)
- Writing Custom Functions
- Automating Tasks with VBA
- Debugging and Error Handling in VBA
- Power Query Editor
- Navigating the Power Query Editor
- Applying Basic Transformations (Replace Values, Remove Duplicates)
- Advanced Transformations (Pivot/Unpivot, Group By)
- Creating Custom Columns
- Merging Queries
- Appending Queries
- Managing Query Steps
Microsoft Power BI
- Introduction to Power BI
- Overview of Power BI and its components
- Power BI Service vs. Power BI Desktop
- Benefits of using Power BI for data analytics
- Key features and capabilities of Power BI
- Understanding the Power BI ecosystem
- User interface and navigation
- Basic concepts and terminology in Power BI
- Installation of Power BI Desktop
- System requirements for Power BI Desktop
- Step-by-step installation guide
- Initial setup and configuration
- Updating Power BI Desktop
- Troubleshooting common installation issues
- Licensing and subscription options
- Importing sample datasets for practice
- Connecting Power BI with Other Sources
- Supported data sources in Power BI
- Connecting to databases, cloud services, and files
- Data import methods and best practices
- Managing data connections
- Data refresh and scheduling
- Handling data privacy and security
- Using Power BI gateways
- Basic Visualization in Power BI
- Types of visualizations available in Power BI
- Creating basic charts and graphs
- Customizing visualizations (colors, labels, titles)
- Using slicers and filters
- Creating and managing dashboards
- Adding interactivity to visualizations
- Publishing and sharing reports
- Advanced Visualization in Power BI
- Using advanced chart types (Waterfall, Funnel, Gauge)
- Creating and using bookmarks
- Implementing drill-through functionality
- Using custom visuals from the marketplace
- Creating dynamic visualizations with DAX
- Advanced interactivity techniques
- Combining multiple visualizations in a single report
- Advanced DAX
- Introduction to DAX: Calculated Columns, Measures, and Tables
- Time Intelligence Functions
- Filtering Functions
- Advanced Calculations and Complex DAX Queries
- Optimizing DAX Queries for Performance
- Practical Applications of DAX in Data Models
- Introduction to Power Query
- Overview of Power Query and its interface
- Connecting to various data sources
- Understanding the M language
- Basic data import and transformation
- Using the Query Editor for data preparation
- Managing and combining queries
- Best practices for efficient data queries
Tableau Tool
- Tableau Basics
- Introduction to Tableau and its components
- Tableau Desktop vs. Tableau Public
- Key features and benefits of Tableau
- Understanding the Tableau interface
- Basic concepts and terminology in Tableau
- Connecting to data sources
- Creating your first visualization
- Design Features
- Overview of Tableau design principles
- Customizing visualizations (colors, labels, titles)
- Using shapes and images in dashboards
- Applying themes and templates
- Formatting numbers, dates, and text
- Enhancing aesthetics with backgrounds and borders
- Best practices for dashboard design
- Time Series Analysis
- Understanding time series data
- Creating time series visualizations
- Using date functions in Tableau
- Time series forecasting
- Analyzing trends and seasonality
- Implementing moving averages and running totals
- Comparing time periods
- Aggregation and Granularity
- Understanding aggregation in Tableau
- Adjusting granularity of data
- Using calculated fields for aggregation
- Aggregating data in visualizations
- Customizing aggregation settings
- Drilling down and rolling up data
- Aggregation best practices
- Filters
- Types of filters in Tableau
- Applying filters to visualizations
- Using quick filters and filter actions
- Creating dynamic and cascading filters
- Managing filter hierarchies
- Filter optimization techniques
- Best practices for using filters
- Maps and Scatter Plots
- Creating and customizing maps
- Using geographic data in Tableau
- Implementing map layers and controls
- Creating scatter plots and bubble charts
- Analyzing data with scatter plots
- Adding interactivity to maps and scatter plots
- Combining maps with other visualizations
- Joining and Union
- Understanding joins and unions in Tableau
- Types of joins (inner, left, right, full)
- Performing data joins in Tableau
- Using unions to combine datasets
- Managing data relationships
- Handling data blending
- Best practices for joins and unions
Generative AI (GenAI)
- Foundations of LLMs & Prompt Engineering
- Fundamentals of LLMs
- Understand how LLMs work, including tokenization and embeddings.
- Explore how models like GPT interpret and generate text.
- Project: Visualize and compare embeddings.
- Prompt Engineering in Practice
- Learn how to structure and format prompts effectively.
- Understand chat roles: system, user, assistant.
- Practice designing multi-turn prompts and chaining logic.
- Project: Create a multi-turn chatbot.
- Prompt Engineering with OpenAI API
- Apply prompting techniques for summarizing, classifying, and transforming text.
- Use OpenAI API to test and iterate prompts programmatically.
- Project: Implement and compare zero-shot, one-shot, and few-shot prompts for text summarization, sentiment detection, and email drafting.
- Building Systems using Generative AI
- Apply prompt engineering to solve real-world text tasks.
- Split complex tasks into a pipeline of subtasks using multi-stage prompts.
- Evaluate LLM inputs and outputs for safety, accuracy, and relevance.
- Project: Build a customer-support agent that can flag, retrieve, and answer user queries.
- Fundamentals of LLMs
- LangChain & Agent Systems
- Application Development using LangChain
- Understand the core LangChain framework.
- Learn how to use your own data with RAG (Retrieval-Augmented Generation).
- Build chatbots powered by structured chaining logic.
- Project: Create a document Q&A assistant using LangChain and your own PDFs.
- Multi-Agent Systems with AutoGen
- Learn to scale LLM performance through Agentic AI systems using AutoGen.
- Compare agent patterns such as coordinator-worker, role-based agents, and tool-invoking agents.
- Explore real-world task automation like document processing or customer service escalation.
- Optional: Contrast AutoGen with CrewAI for understanding trade-offs.
- Project: Build a 3-agent AutoGen system to automate customer support (intake, triage, escalation).
- Agentic Design with LangGraph
- Learn to design structured agent workflows with LangGraph.
- Combine LangGraph’s visual DAG-based control with AutoGen’s conversational memory.
- Project: Implement a LangGraph/AutoGen hybrid agent that dynamically routes tasks and retries failed steps.
- Reasoning with LLMs
- Learn how reasoning models work and when to use them.
- Use chain-of-thought and self-reflection prompting techniques.
- Apply reasoning to code and vision-based tasks.
- Project: Use reasoning prompts to debug code and answer image-based questions step-by-step.
- Application Development using LangChain
- Reasoning Models & Advanced Agents
- Advanced Use Cases with AutoGen
- Design collaborative multi-agent systems using AutoGen’s planner-executor framework.
- Integrate diverse LLMs and tools, support memory/context sharing, and enable agents to reason, critique, and self-correct.
- Inject domain-specific logic, external APIs, and feedback loops for robust automation.
- Project: Build an AutoGen-based resume screening system that ranks candidates using dynamic criteria.
- Build with Anthropic – Computer Use
- Understand Anthropic family of models, best practices, and multi-modal use cases.
- Implement low-latency and cost-saving techniques like prompt caching.
- Learn multi-modal and tool-augmented use cases.
- Project: Build an AI assistant that opens a file, summarizes content, and suggests edits.
- Reasoning + Agent Project Sprint
- Apply reasoning and agent collaboration in a high-impact use case.
- Combine LangGraph for workflow structuring and AutoGen for autonomous reasoning agents.
- Project: Build a “Virtual Analyst” that reasons over documents, answers queries, and summarizes trends.
- Advanced Use Cases with AutoGen
- Memory, Context Protocols & AI Safety
- Long-Term Memory with LangGraph + AutoGen
- Build agents with evolving memory using AutoGen’s user memory modules and LangGraph’s persistent nodes.
- Support personalization and context continuity across sessions.
- Project: Extend AutoGen agents with long-term adaptive memory.
- Model Context Protocol (MCP)
- Learn how MCP standardizes tool and data access across apps.
- Connect multiple AI agents and services using a shared protocol.
- Deploy and manage MCP servers and clients.
- Project: Deploy an MCP server and connect mini-apps that share user context.
- Guardrails for AI Systems
- Recognize common failure modes in LLM systems.
- Use guardrails to validate and filter model inputs and outputs.
- Integrate I/O controls into RAG and agent-based apps.
- Project: Add guardrails to a Generative AI app to block unsafe, biased, or irrelevant responses.
- AI Project Best Practices – Building and Deploying End-to-End Applications
- Learn the lifecycle of AI product development: scoping, prototyping, testing, and deployment.
- Explore trade-offs: prompting vs. fine-tuning, cost vs. accuracy, latency vs. interactivity.
- Understand fine-tuning fundamentals and implications.
- Learn best practices for versioning, observability, feedback collection, and human-in-the-loop integration.
- Evaluate AI systems for quality, safety, and robustness.
- Long-Term Memory with LangGraph + AutoGen
Features
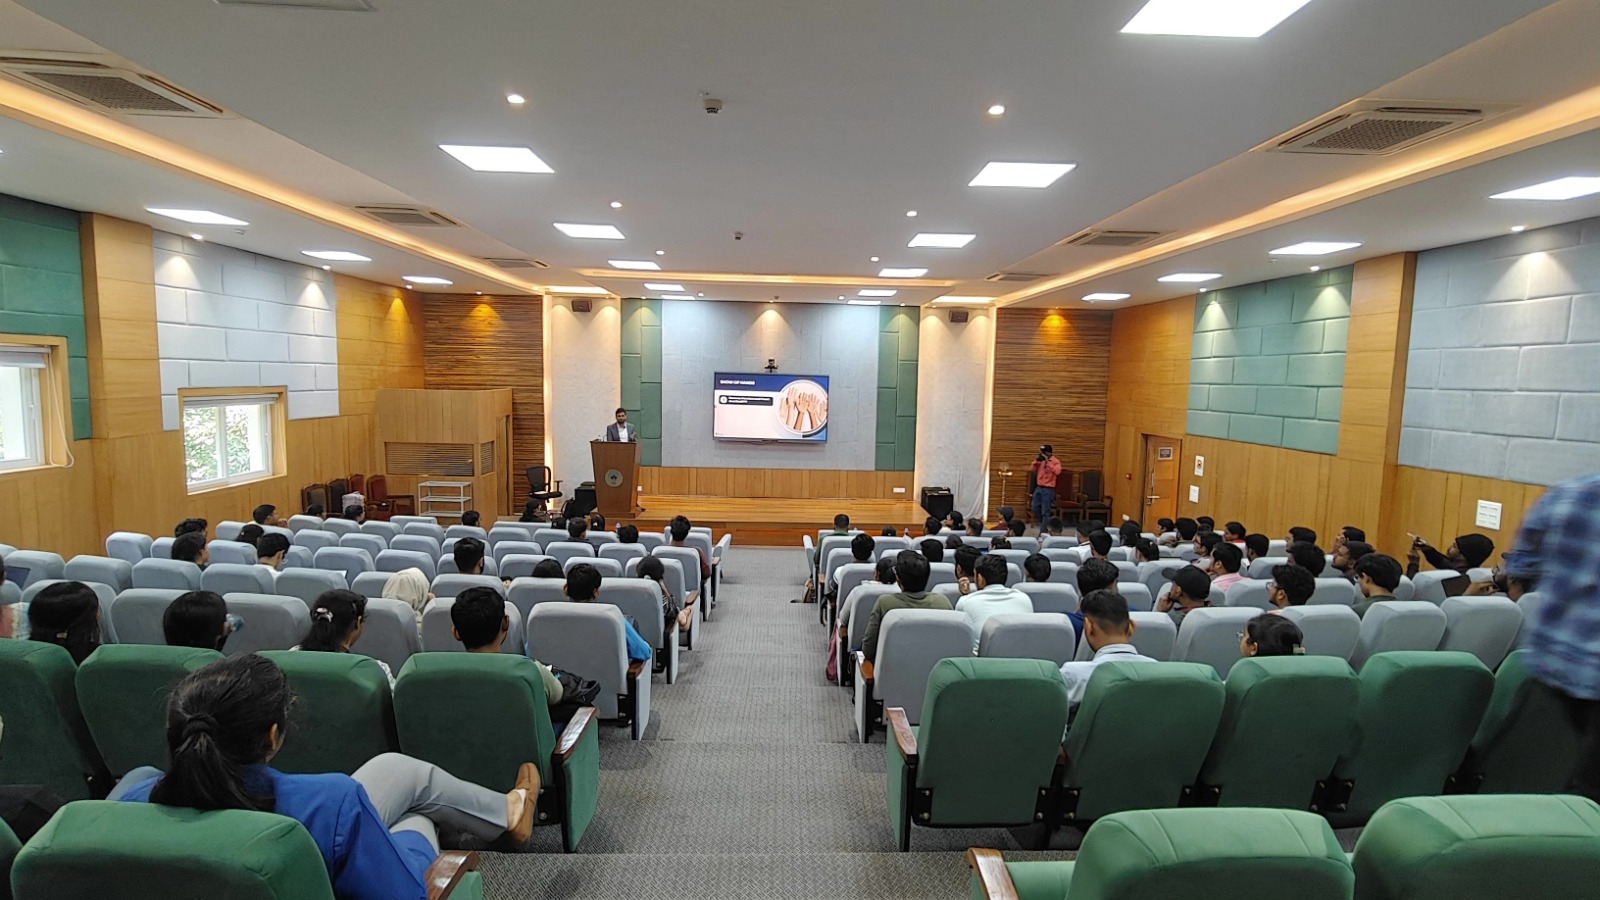
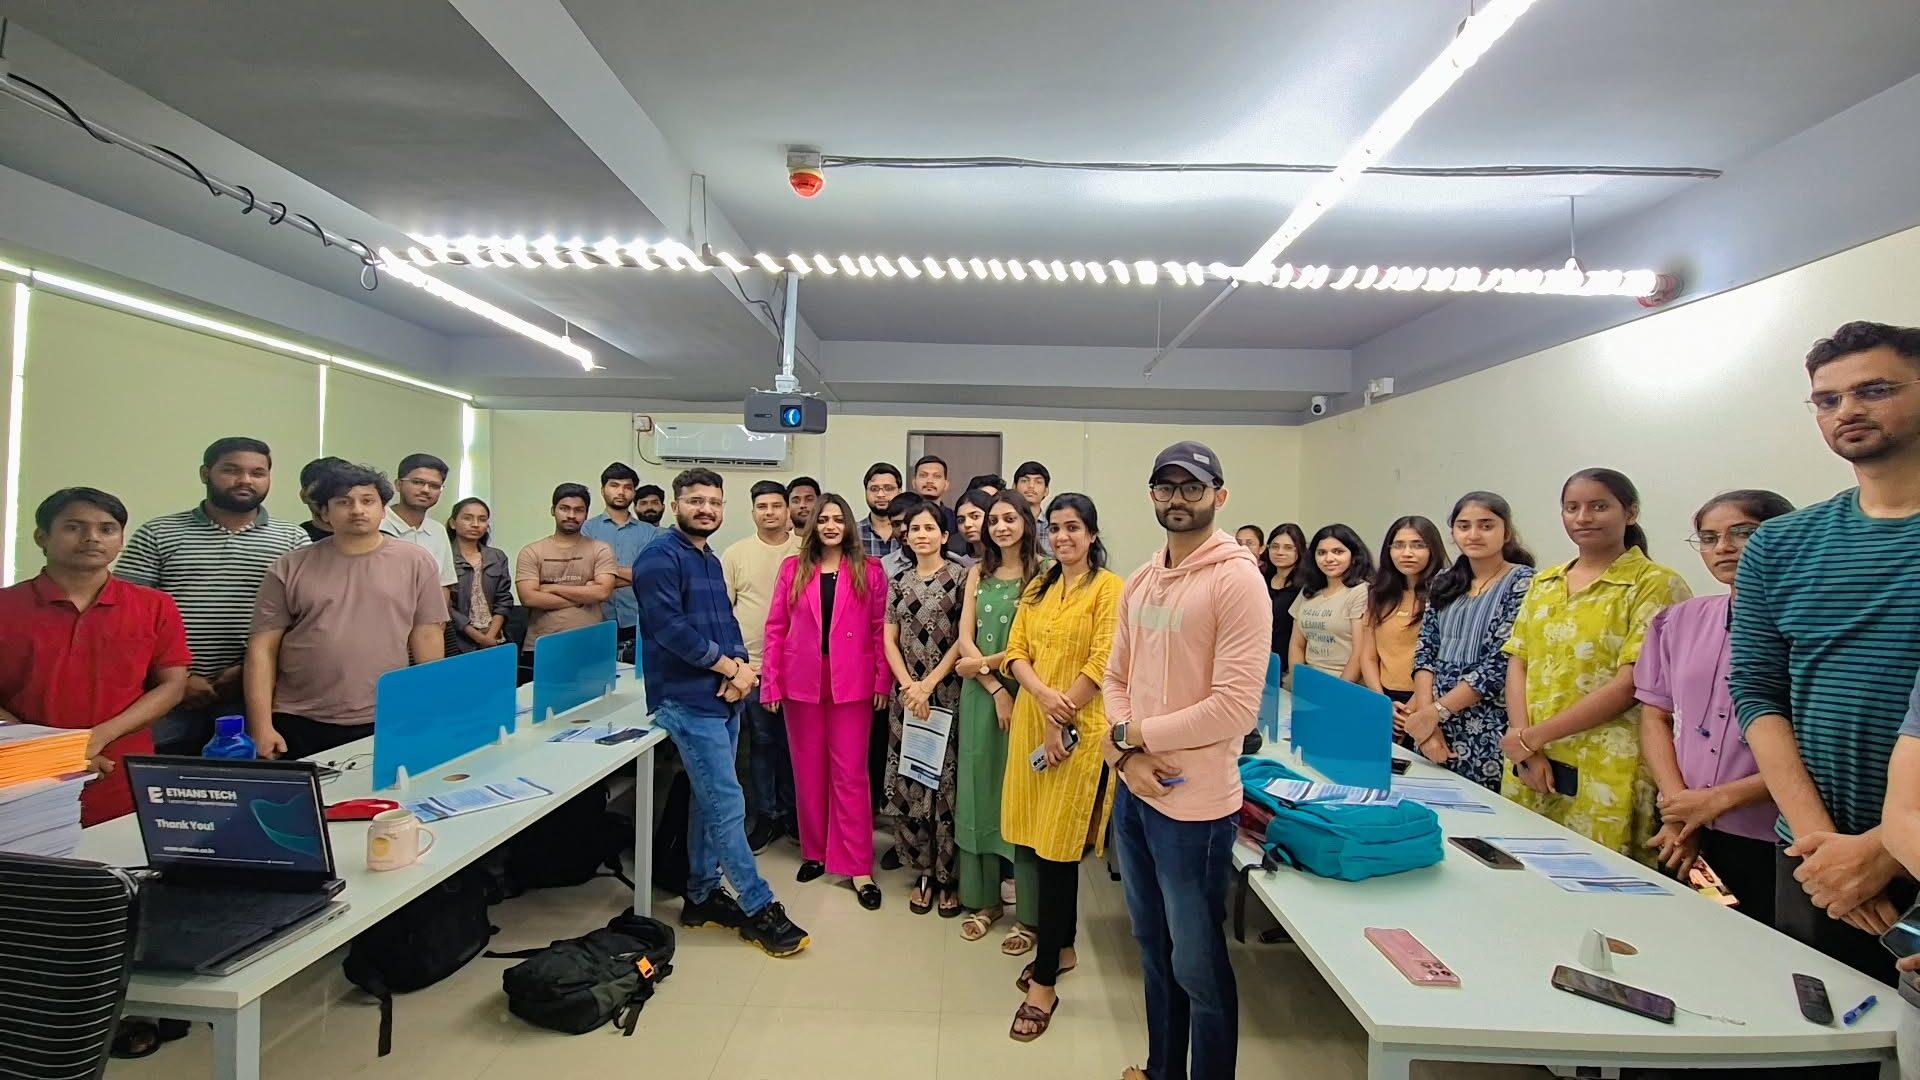
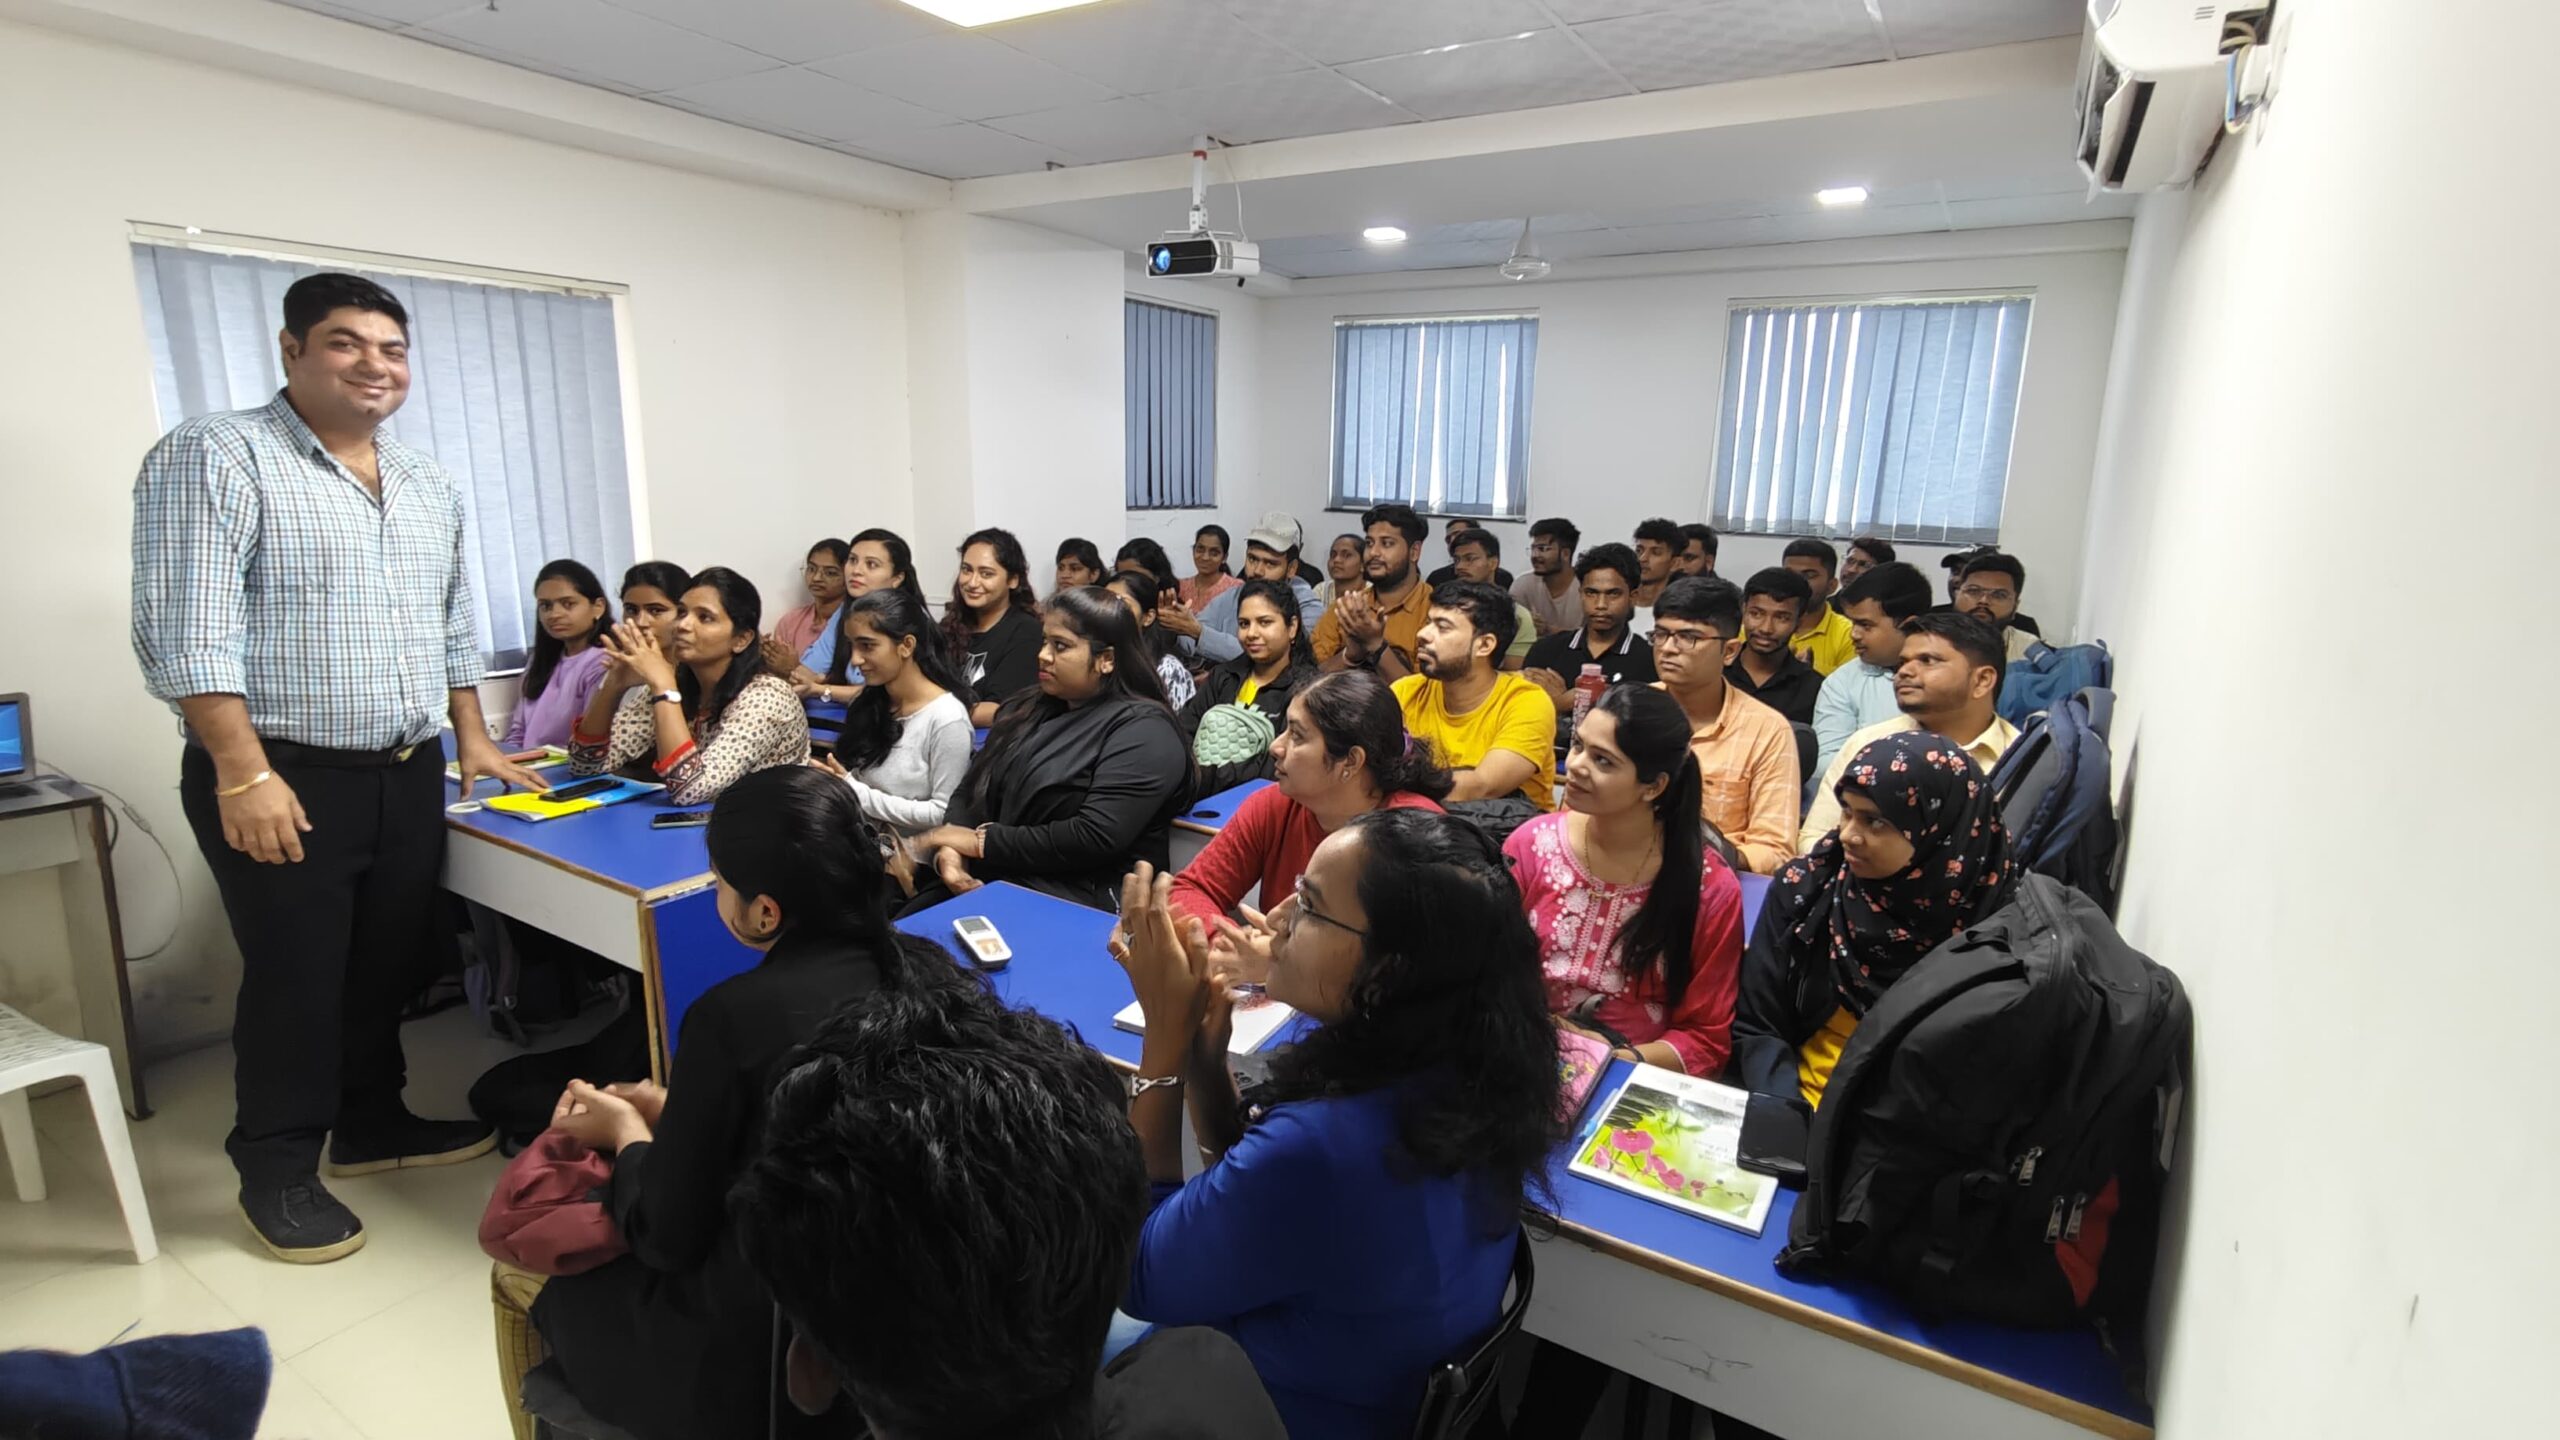
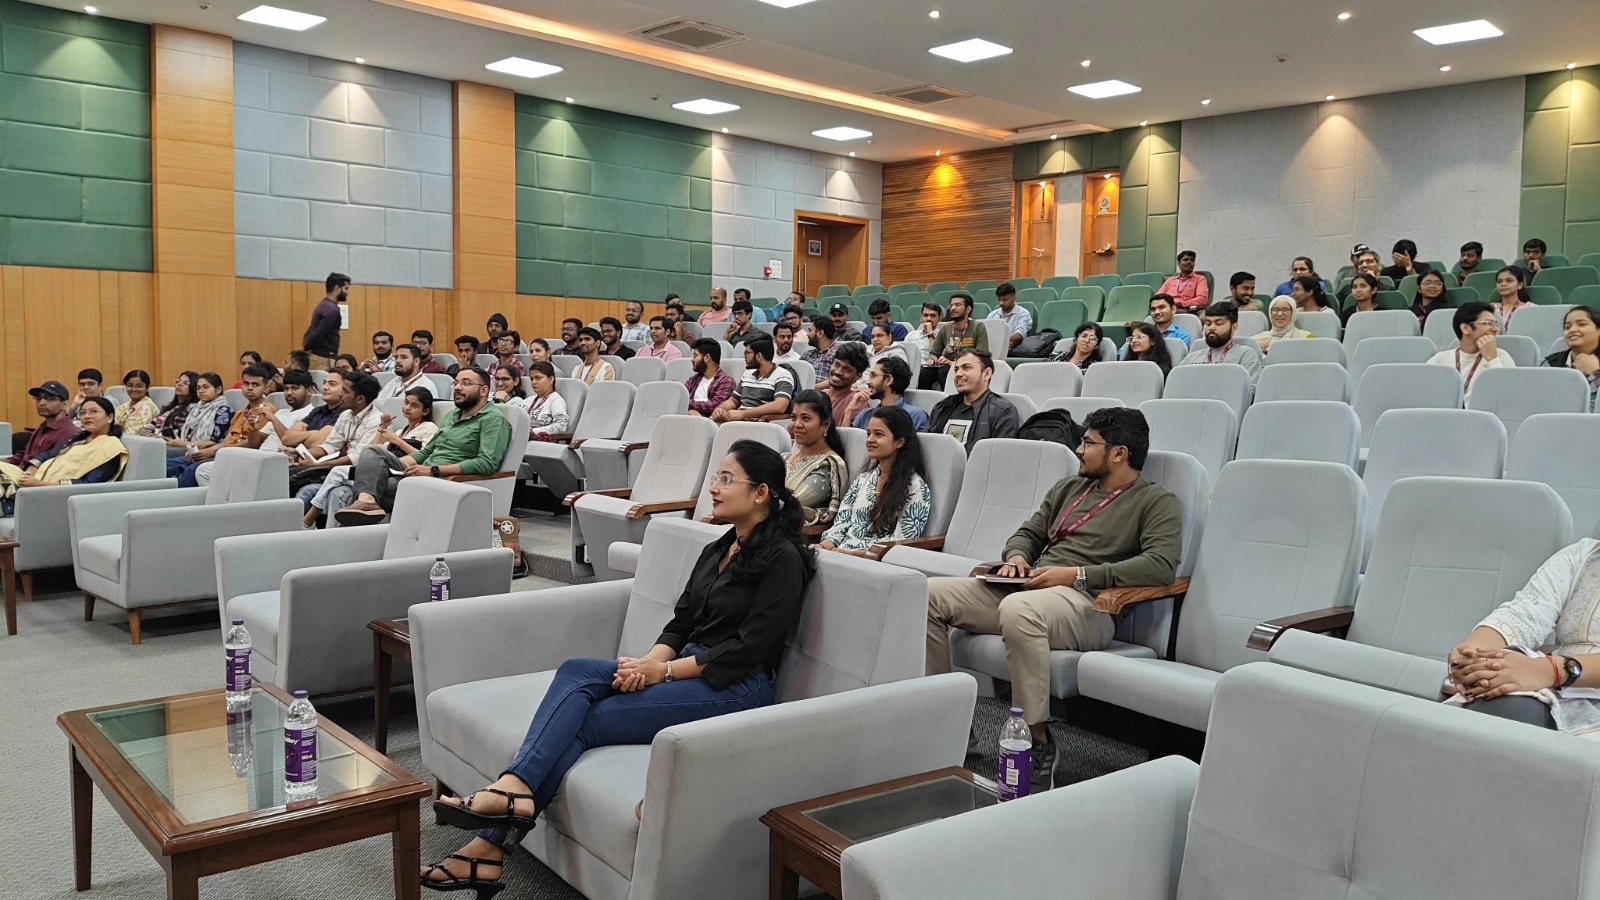
Classroom Sessions
Ethans Pune delivers training designed to meet real-world demands, with strong emphasis on hands-on and project-based learning. Sessions are interactive, ensuring individual attention for every student. Learners also get access to online doubt-clearing sessions, recorded backup classes, and a discussion forum for continuous academic support.
Learning Management System
Our LMS provides free add-on courses to strengthen cross-functional skills required in the industry. Students can revisit recorded sessions from their ongoing batches and access structured study resources. These include assignments, projects, POCs, and reference materials that support learning across all modules and help reinforce key concepts.
Quiz, Assignments & POC's
Each course is supported with topic-wise quizzes, practical assignments, and interview-oriented tasks. Assignments are customized based on student skill level and project needs, typically requiring around one hour daily. These tasks simulate real company scenarios, ensuring hands-on exposure, along with complementary study material for every module.
FutureSkills Prime Certification
Ethans is an ISO 9001:2015 certified institute, offering certifications recognized across industries. After successful assessment by industry experts, students receive a course completion certificate endorsed by FutureSkills Prime. This certification adds credibility to your profile, strengthens your resume, and enhances opportunities upon course and project completion.
Real-life Case Studies
Ethans integrates real-time projects with practical business use cases into its curriculum. Students learn to understand business requirements, perform analysis, and solve implementation challenges. This hands-on approach bridges the gap between theory and practice, helping learners gain confidence by applying concepts to real-world industry scenarios.
Job Assistance Program
After completing a course, eligible students can opt for Ethans’ job assistance program. This includes resume building, profile optimization, and interview guidance. With a strong alumni network of over 5,000 members, job opportunities are regularly shared. Over 3,000 students have successfully placed across leading companies in India.
Learning Management System Here (LMS)
Learn anytime, anywhere & track your progress.
- HD VIDEO
- 24/7 LEARNING
- TRACKER
Industry Projects
Data Analytics-Based Smart Expense Tracker Using Automated Categorization and Reporting
This project uses data analytics tools to track user expenses, categorize transactions automatically, generate reports, identify spending patterns, and help users understand monthly financial behavior effectively.
Data Automation Tool for Dataset Organization and Cleaning
This project creates a data analytics automation solution that organizes datasets, removes duplicates, handles missing values, standardizes data formats, and improves overall data quality with minimal manual effort.
Data Analysis System for Student Performance Prediction Analytics
This project builds a data analysis and predictive reporting system to analyze student performance based on attendance, study habits, assessment history, and other factors, helping educators provide timely academic support
Data Visualization Dashboard for Tracking Daily Productivity Trends
This project uses analytics and visualization tools to present productivity data, highlight trends, display efficiency variations, and help users understand how daily habits impact overall performance actionable insights.
Trusted by Leading Platforms

Top-Rated Institute
Featured for Excellence

Top AI Institute

Academic Partner
Data Analytics – Program Highlights
Unlock the power of data analytics with Ethan’s Tech’s Data Analytics Certification, crafted for aspiring data analysts and business intelligence professionals. This program takes you from absolute basics to advanced analytical techniques, equipping you to work with real-world datasets and reporting workflows.
- 15+ Hands-on Projects – Gain practical expertise by working on real-time Python projects and use cases across domains.
- Internship Integrated Program in Data Analytics – Learn and apply your skills in real business scenarios with hands-on internship experience.
- Comprehensive Coverage - Master core concepts including Excel, SQL, Python, data cleaning, data visualization, statistics, dashboards, APIs.
- Tied-Up with 500+ Companies – Explore job opportunities with top recruiters hiring for Python-related roles.
- 100% Career Support. Access our unique POD hiring platform, career mentorship, and placement assistance.
- Master Reporting & Data Insights – Learn how to analyze data, create dashboards, automate reports, and support data-driven business decisions.
- Job Readiness Program – Includes resume building, mock interviews, and soft skill training to prepare you for tech interviews.
- Recognized Certification – Earn an industry-recognized certificate and receive dedicated support to launch your career in data analytics.
- Receive industry-recognized certification and 100% placement support, including resume building, mock interviews.
Up-Skill with an Industry-Recognized Certificate
Gain a competitive edge in the job market with our industry-recognized certification, designed to validate your skills and elevate your career.
Validated Certification from Ethans Tech
Receive a professional certificate that validates your expertise and is recognized across leading IT companies.
Training Backed by Real-World Expertise
Ethans Tech follows a practical, hands-on training approach aligned with industry needs, boosting your job readiness.
Professional Credential for Career Growth
Showcase your technical skills with a credible certificate that strengthens your portfolio and improves hiring prospects.
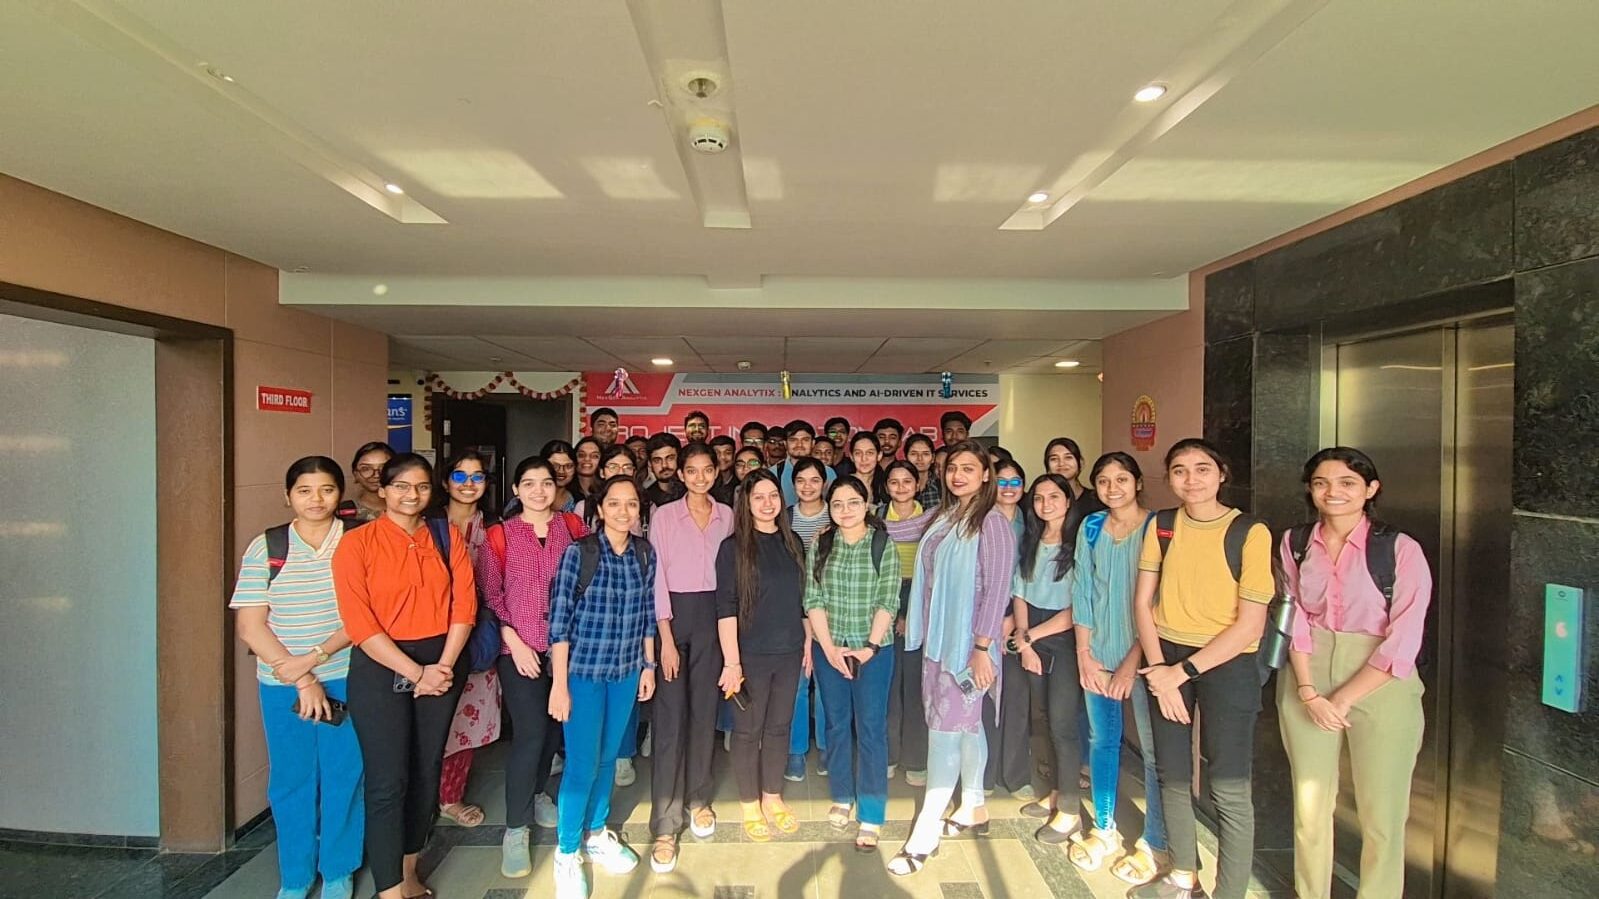
Internship Certificate by Nexgen Analytix
Gain an official internship certificate showcasing your practical experience and real-time project exposure.
Verified Industry Internship Recognition
Highlight your applied skills, teamwork, and domain knowledge through a certificate trusted by employers.
Career-Boosting Professional Doc
Add the internship certificate to your resume and LinkedIn to demonstrate hands-on experience and industry exposure.
Master 12+ In-demand Skills in Data Analytics Course
- Data Analytics Fundamentals
- Descriptive & Inferential Statistics
- Business Metrics & KPIs
- Data Collection & Cleaning
- Data Wrangling with Python/pandas
- Analytics Project Deployment
- Excel for Data Analysis
- Exploratory Data Analysis (EDA)
- Database Integration (MySQL, SQLite)
- SQL & Database Querying
- Predictive Analytics Basics
- Data Analysis with pandas & NumPy
- Data Visualization (Power BI, Tableau)
- Dashboard & Report Creation
- Data Analysis with pandas & NumPy
Why to Join this Program
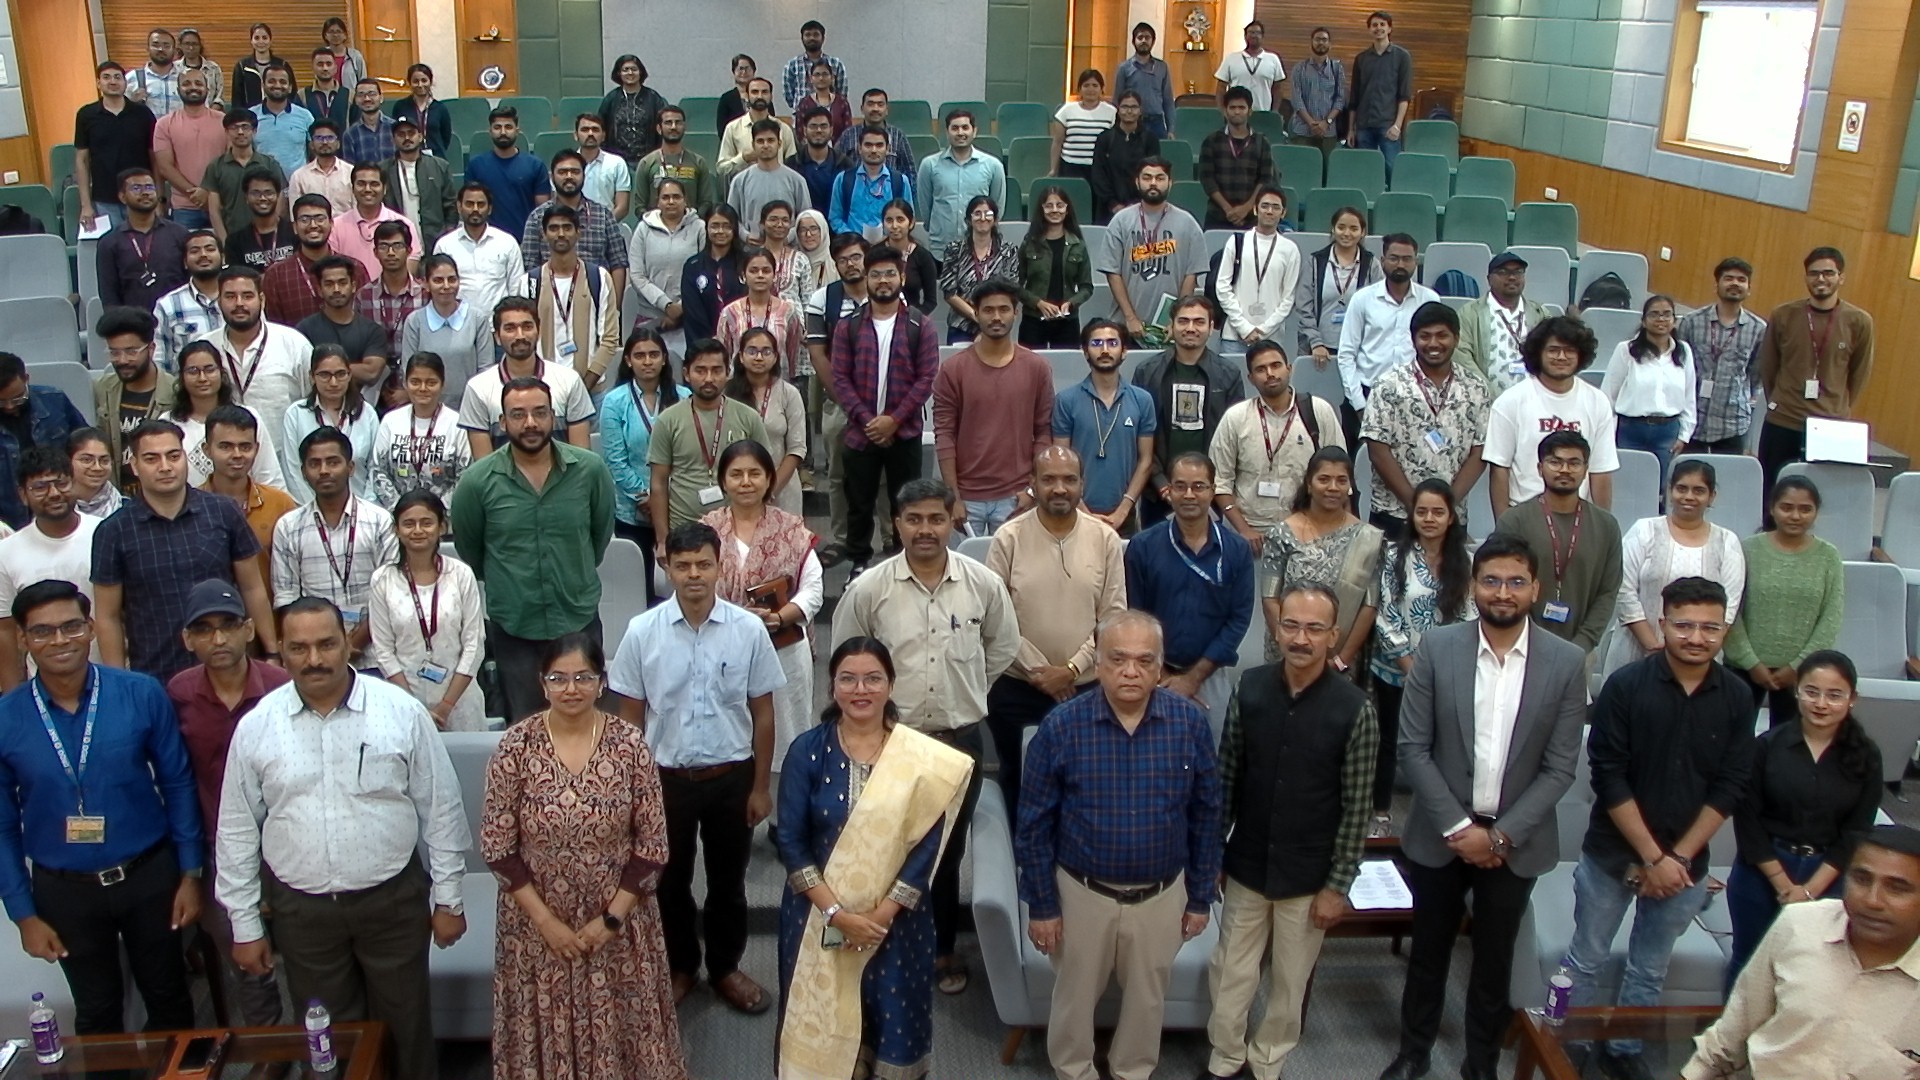
Guest Lectures by IIT professors
Learn directly from top IIT faculty through hands-on, real-time sessions
Ethan’s Tech Career Track
Flexible timelines to complete your course and projects at your own pace
IIT Approved Mentors
Get personalized guidance and career insights from experienced professionals
Advance Curriculum
Master concepts from basic to expert level through structured, applied learning
4.7

4.6
4.5

Next Batch Starts on
11th Apr
Why Choose Ethan’s Tech?
OTHERS
- Breadth and Depth of Curriculum
- Beginner-Friendly Bootcamp
- GenAI Integration
- Specialised Paths
- Projects Experience
- Alumni & Outcomes
- Hands-On Learning Model
- Mentorship & Faculty Access
- Comprehensive
- Structured Start
- Fully Applied
- Multiple Tracks
- Real-World & Personalized
- Large Network
- Applied & Practical
- Expert-Led
- Limited
- No On-Ramp
- Light Touch
- One Track
- Minimal & Fixed
- Small Base
- Theory-Heavy
- Basic Support
Our Alumni Works Here!


What our Students Say
Ethan’s Tech played a key role in shaping my Python development skills. The course focused on core concepts with real-world applications. Trainers explained topics clearly and provided support. This training helped me gain confidence and secure my role as Python Developer at Automata Pvt. Ltd.


Sarthak Arsul


Cloud Engineer | Minutus Computing
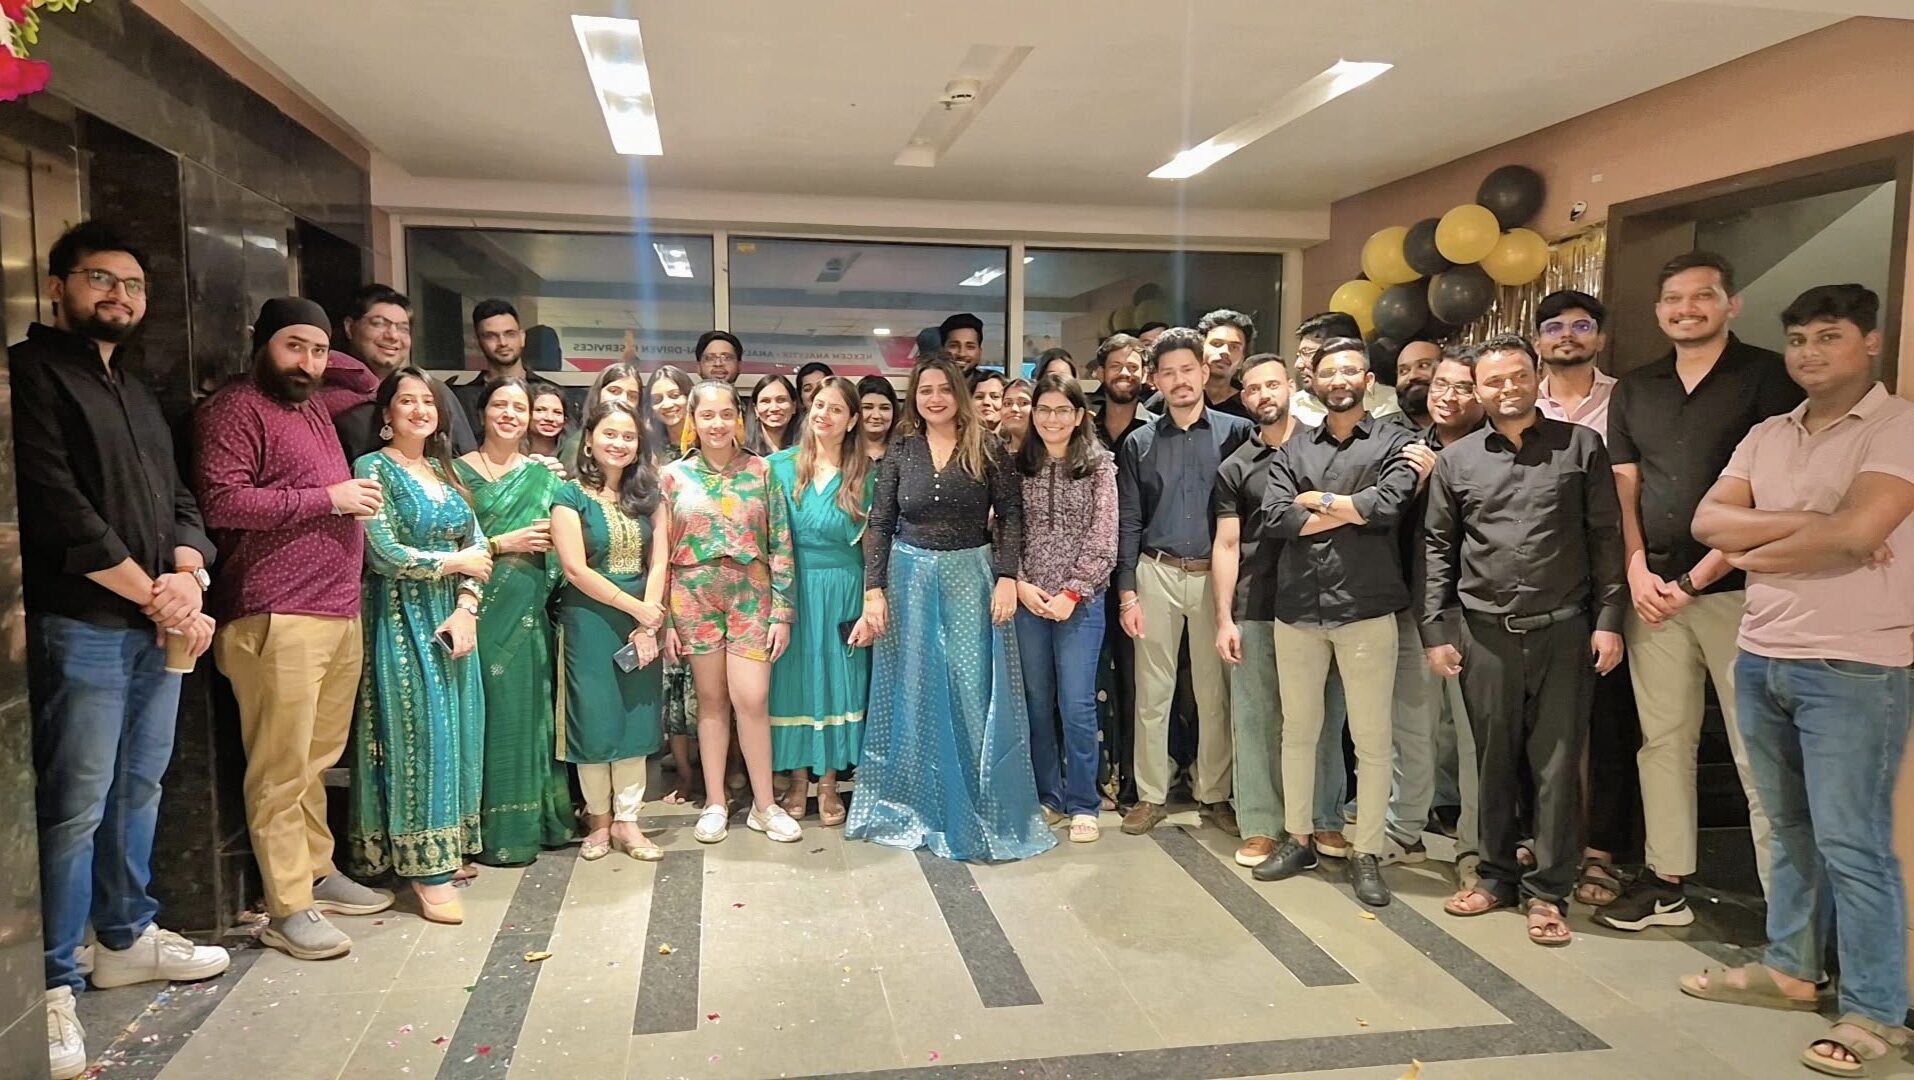
Ethan’s Office Tour
Ethans Tech is a leading professional training institute founded with the mission to bridge the gap between academic learning and real-world skills. With a strong presence in Pune and expanding across India, Ethans Tech has trained thousands of students and working professionals, helping them upgrade their careers in the most in-demand technologies.
The name “Ethans” represents a commitment to “education with excellence”. It’s not just a name; it’s a culture — built by passionate industry experts who believe in practical, hands-on learning rather than rote education. Every trainer at Ethan’s is a seasoned professional with real industry exposure, making the learning experience highly relevant, practical, and impactful.
At Ethans, it’s not just about completing a course — it’s about building a career.
Ethans Tech is a premier professional training institute dedicated to bridging the gap between academic education and real-world industry skills. Headquartered in Pune and expanding across India, Ethans Tech has empowered thousands of students and working professionals to advance their careers in today’s most in-demand technologies. With experienced industry trainers and a strong focus on practical, hands-on learning, the institute ensures highly relevant and career-oriented training that prepares learners to succeed in the professional world.
Get a Free Consultation!
Call us today and get your queries answered by our top experts.
Learners Profile
- 11% – College Graduates (Non-technical backgrounds)
- 23% – B.Tech & M.Tech Graduates (CS, IT, ME, CIVIL)
- 27% – BCA, B.Sc (IT/CS/Maths/Stats) Graduates
- 23% – Early Career Professionals (1–6 years of experience)
- 16% – Career Comeback Learners (with a gap in education or employment)
This blend of learners adds immense value to the learning experience — offering unique perspectives, fresh ideas, and real-world context to every session
Learner Profiles & Trusted Companies
Data Analytics Classes in Pune FAQs
Everything you need to know about the program.
What are the prerequisites for Data Analytics Training in Pune?
The basic requirement for learning a Data Analytics course is Programming language, Data Structures and algorithms, and Mathematics
Who should learn Data Analytics Course in Pune?
Data Analytics Training is open to all students. As per our teaching experience teaching students from non-IT backgrounds can also learn this technology. Students in a class are mixed from 1 year of experience to 24 years of working experience. Even CA, CS, BCom, and Share Brokers, learning this skill for implementing the same into day-to-day activities. It’s the finest kick-off for the freshers and icing on the cake, for others.
What if I have queries after I complete this course?
You will have access to the technical discussion forum lifetime, which will help you in resolving most of your doubts and queries. Eventually, you can connect with your respective faculty directly, else reach out to the nearest Ethans help desk for further assistance.
Who are the instructors?
Will Ethans be providing any study materials?
What types of courses are available at Ethans?
Does Ethans provide Job Assistance?
Does Ethans provide weekend classes for professionals?
What are the profiles and experiences of trainers at Ethans?
Do I need to pay the complete fee lump sum or I can have an installment facility too?
The fee which I will pay is refundable or transferable?
What are the facilities and infrastructure at Ethans?
Does Ethans provide Online Training?
Does Ethans provide facility to repeat the batch?
Does Ethans provide Institutional Certification after the course?
Does Ethan's conduct training at Corporates?
Yes, we are frequently engaged in corporate training being the market leader with a big pool of corporate trainers having a wide network with collaboration with several top MNC’S that ultimately becomes an add-on for placing our students with such references.